
Common Retail Systems for Precious Jewellery Businesses, How to Smartly Utilize its Data for Higher Revenue Generation
The Precious Jewellery sector has been the slowest to adopt technology & even if they have adopted technology except for the corporates, most of the Jewellers have only been using it to measure Sales, Revenue, P&L etc. However if technology is utilized correctly without making any significant investments, the learnings from its data can immensely help every Jeweller increase their Revenue, Profitability & Sales.
To elaborate further I would classify Retail Jewellers in the following Categories & identify the Systems typically used by them
- Boutique Jewellers: Have limited systems usage, mainly Invoicing & Accounting systems
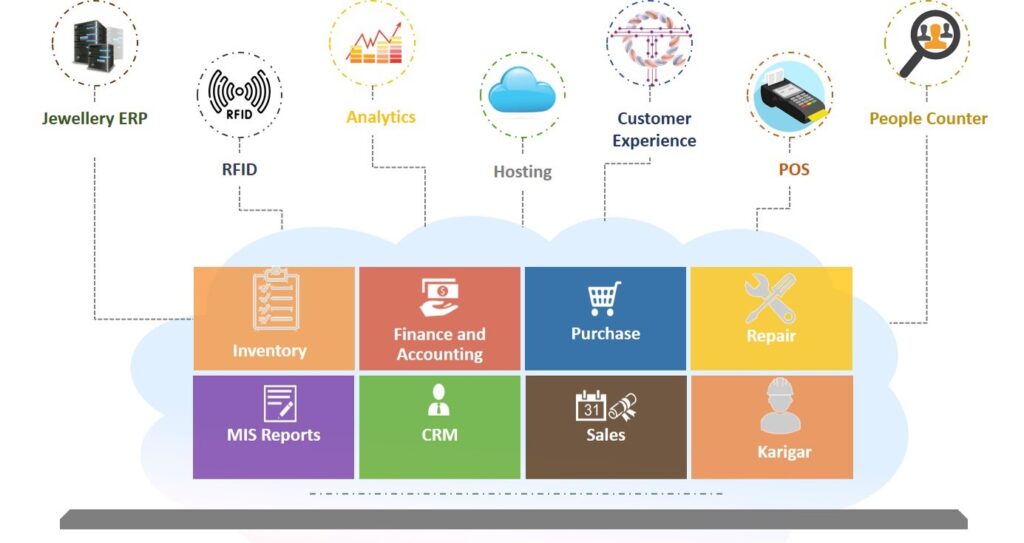
- Single Store Jewellers: Systems usage range from Purchase, Sales, Inventory, Accounting
- Multi Store Jewellers: Generally have comprehensive usage of systems like Purchase, Inventory, Sales, Karigar, CRM, Repair, Analytics etc
When it comes to performance, numbers don’t lie, here is where we will utilize your existing systems data & measure performance to identify areas for improvement. One of the first things you should do is look at your retail metrics / KPIs (key performing indicators). They’re called key performance indicators for a reason: they help you gauge your performance, so you can decide on the right course of action.
We will explain simple methods used to measure KPIs & how to use them to achieve significant improvements in your Business.
Retailers using bigger setups will most likely have Analytics Solution to do the number crunching, however it is also important to understand whether you are utilizing those numbers in the correct manner or are the specific KPIs even getting measured at all?
Out of the many KPIs, the 4 Important Metrics to be measured for quick results are as follows
- Retail Conversion Rate: How good are you at turning lookers into buyers, traffic alone won’t add much to your bottom line if your visitors don’t convert.
Formula
Conversion Rate = (No of Transactions/Footfall) * 100
Data Required
No of Invoices from your Invoicing/Sales system will give you No of Transactions, People Counter system or Manual count will give you Footfall.
Simple & inexpensive People Counters are available in market, either log into their system to manually check Footfall count or you can integrate the output with your existing Analytics solution. Also precious jewellery buying is generally not done by individuals, hence we need to consider the average group size to calculate the footfall. For e.g if the Avg Grp Size is 4, Total Footfall for 3 months is 6000, then your actual Footfall will be 6000/4 = 1500.
Firstly you need to determine a Time-Period you would like to measure the Conversion Rate, for example if you have been advertising for the past 3 months about a new Collections & hence you achieved a 3 monthly Footfall of 1500.
Let say the No of transactions for the 3 months is 500, hence your Conversion Rate = (500/1500)*100
That’s 33.33%, As per conventional wisdom a conversion rate of 15% & lower is bad for business & must be addressed.
If you have a Lower Conversion Rate, then the Possible Learnings can be as follows
- Train your Salesman better to Build Rapport, Become experts of the field, Be Convincing without being Pushy
- Re-work on Product Quality, Designs, Product Showcase & Lighting, Adopt New Technology (like ToggleArt)
- Re-work on Return Policy, make it very easy & convenient
2. Average Transaction Value(ATV): ATV is useful for developing a Sales Growth Strategy. By understanding consumer purchasing behaviors you can develop strategies to strengthen certain tendencies such as incentivizing to purchase higher margin products or upselling other products.
Formula
Average Transaction Value= Total Transaction Value/No of Transactions
Data Required
Total Invoice value from your Invoicing/Sales system will give you Total Transaction Value & No of Invoices will give you No of Transactions
Determine a Time-Period to measure the Average Transaction Value
If you have a Lower ATV, then the Possible Learnings can be as follows
- You may not have a Clientele willing to buy Higher Priced Products
- You might have to increase Product Assortments for the lower priced products to give more options for cross-selling
- A High Transaction No but Lower ATV indicates you need to Re-work on the Pricing & Discounting Strategy
- You will have to Plan an Inventory of Lower Priced Products more as per observations
If you have a Higher ATV still there are Possible Learnings as follows
- Plan to have an Inventory of Higher Priced Products more as per buying observations
- ATV is also a function of No of Units per Transaction, hence continue to increase your Product Assortment giving you options to cross-sell
- Sell-Through Rate (STR): Helps estimate how quickly Retailers can sell a Product & convert their investment into Revenue. A Sell-Through Rate can be calculated by Product-Type, Product-Category, Brand, Markdowns, any other Category etc. STR helps to analyze your Inventory, Buying skills & Supplier Performance.
Formula
Sell-Through Rate: (No of Units Sold/No of Units Purchased)*100
Data Required
Either you will have to calculate manually by referring to every Invoice or generate Month-wise Sales report to give you No of Units Sold, For No of Units Purchased from Accounting System or Purchase Systems report will give you the Nos
Determine a Time-Period to measure the STR
If you have a Lower STR, then the Possible Learnings can be as follows
- Your Products are not moving fast, identify which Products or Styles etc are doing well & which you might have to stop buying. Allocate higher buy budgets to Products doing well
- Identifies Supplier performances based on whether the Style, Quality, Designs work or not
- Work on Pricing Strategy & Pricing Markdown, these points also help during Supplier negotiations so you do not shoulder the discounts alone
If you have a Higher STR still there are Possible Learnings as follows
- You may not be stocking enough & Customers are dealing with frequent Stockouts
- Improve your Demand Forecasting
- Plan re-ordering once Products reduce to a pre-defined level
- Customer Retention Rate: It lets you know the amount of repeat customers that return to your store. Understanding why customers choose to shop with you rather than competitors or in some cases the other way is the key to improving your customer retention rate. When Businesses increase their Customer Retention by 5%, they often grow their Profits by 25% to 45%.
Formula
Customer Retention Rate = ((Total No of Customer for the Period – Total No of New Customer Acquired during the same Period)/Total No of Customers at Start of the Period)*100
Data Required
The No of Customers can be provided by CRM system or can be derived from manually referring to Old & New Invoices over a period of time or from the Accounting system where Invoice details are entered.
If you have a Lower Customer Retention Rate, then the Possible Learnings can be as follows
- There seems to be a need to improve your Customer Service
- Deep-dive into your dealings to understand whether you have been running your Business with Clear Business Ethics
- Re-work on the Quality of Products & Pricing
There are many ways to identify areas that needs to be measured, we could only touch upon few important ones. However even these few can provide significant insights into your businesses helping you improve revenues & profitability.
(Author is Co-Founder ToggleArt – A Customer Experience TechnologyBE-MBA, ex-TCSer, ex Co-Founder Carbondrops.com) For questions connect with him on Whatapp @7710009616 or Email viral@toggleart.com